
Heatmaps visualize where your visitors click
AFS Analytics offers you heatmaps to analyze the behavior of your website’s visitors.
Heatmaps allow you to see how your users interact with the pages on your site. Discover the hotspots, view the popular sections, and locate blocking points and areas that are not readily available. All this information will help you optimize the content of your pages and improve your conversion rate.
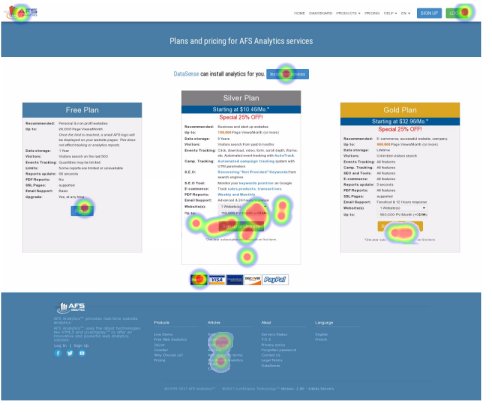
Example of heatmap on AFS Analytics' pricing page
Easy, intuitive and responsive.
The heatmaps are directly projected on the pages of your site. The results are divided into four different resolutions adapted to the devices used by your visitors: smartphone, tablet, desktop, and large screen (TV). With this system, you can immediately identify the zones to optimize according to the device used by your visitors.
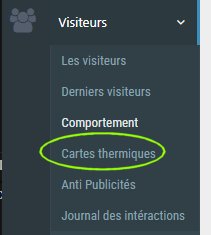
Selecting the heatmap management page.
In the main menu, select the
Creating a Heat Map
To create a new map, press the
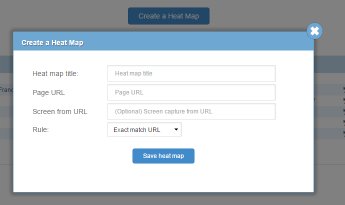
Heat map title:
In this field set the name of the map. Example:
Page URL:
You must fill this field with the URL of the page where user clicks will be captured. Example:Note: This may only be part of the address, in which case the following field must be filled in.
Screen capture from URL (optional):
Use this option to set the address of the page used for the screenshot. This option is useful if you are using passwords protected pages or using the same template for different pages.Rule:
In this field you must specify the rule to be adopted to select the pages where the data will be captured.
1.Exact match URL: The data will be captured only on the page having the same exact address. In our example this will give:
2. URL Contains: The data will be captured on all pages containing the address of the mentioned page. In our example this will give:
The map list
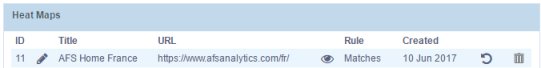
Once created, the maps are displayed in a list giving you access to several options.
Map visualization:
The toolbar:
When you view a map, you have access to a new toolbar. It allows you to view the results by screen type.

By AFS Analytics, Monday, July 10, 2017