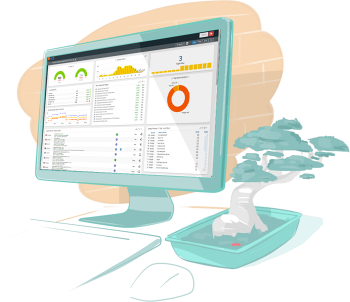
You have just launched your online store and want to track its performance using a web analytics solution designed for e-commerce.
If you want an effective tool that measures your store's progress without overwhelming you with meaningless data, you are in the right place. In this article, we detail the essential indicators for monitoring your online store using a simple, easy-to-install tool.
Essential Metrics for Your Online Store
I. Traffic
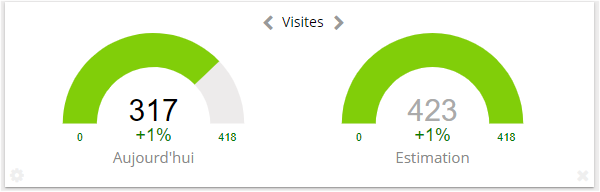
The first thing to monitor is the number of people visiting your store. It measures your store's popularity and tracks its growth over time.
There are 3 indicators for measuring traffic:
1. Number of VisitsThis is the number of users who visited your online store during a given period. A single user may visit multiple times within the same period.
2. Number of Page ViewsThis is the total number of pages viewed by all visitors. The average (page views / visits) indicates visitor engagement with your store. The higher it is, the better. The average for an online store is around 3 page views per visitor.
3. Number of Unique VisitorsThis is the number of distinct users who visited your store during a given period. If a user visits multiple times, they are only counted once.
II. Traffic Acquisition Sources
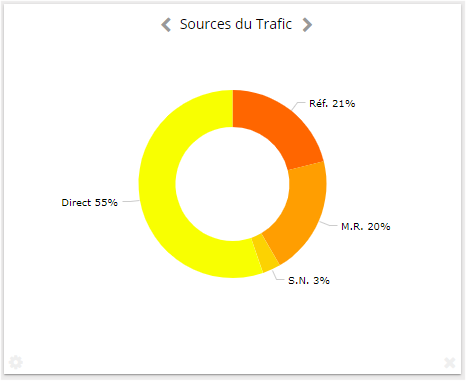
Once you know your traffic volume, it is important to know where it is coming from. There are 6 indicators detailing your acquisition channels.
1. Traffic Sources by Channel:There are 5 different channels: referral traffic, organic traffic, social traffic, marketing campaign traffic, and direct traffic.
2. Referral Sites (Referral Traffic):Shows the volume of traffic sent from other websites.
3. Organic TrafficShows the volume of free traffic coming from search engine queries. Paid search traffic is tracked under marketing campaigns.
4. Social TrafficShows "free" traffic coming from social networks. Paid social traffic should be tracked using UTM parameters.
5. Marketing Campaign TrafficGroups traffic from marketing campaigns including newsletters. For each campaign, you can specify whether it is paid or free.
6. Direct TrafficDirect traffic includes all users who typed your URL directly into their browser or came via bookmarks.
III. Sales & Revenue
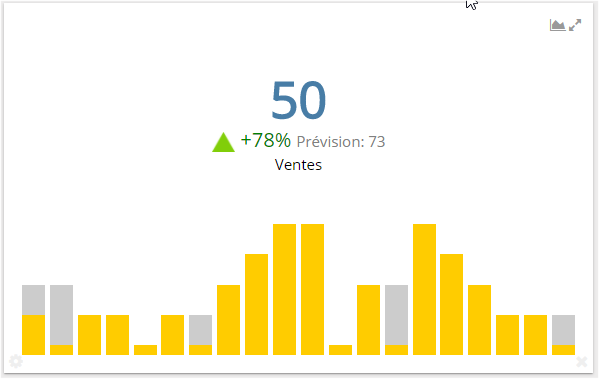
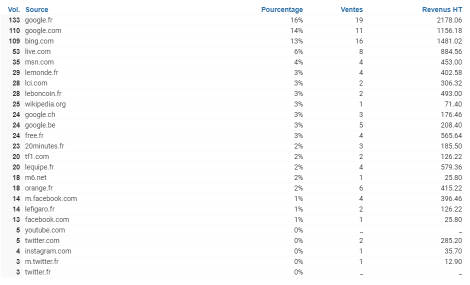
This is the key figure for your online store. You will start by monitoring total sales volume and revenue, then quickly move on to analyzing performance by channel to optimize your conversion rate.
1. Sales VolumeTotal number of orders placed during a given period.
2. RevenueTotal revenue generated by those sales.
3. Sales by Referral SiteShows sales volume and revenue attributed to each referring website.
4. Sales by Search EngineShows sales volume and revenue generated by organic search traffic.
5. Sales by Social NetworkSales and revenue generated by each social network.
6. Sales by Marketing CampaignRevenue generated by each marketing campaign, including newsletters.
IV. Average Order Value
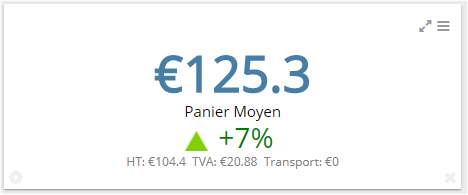
Average order value (AOV) shows the average amount spent by your customers per order. Every merchant wants to see this figure grow — it means increasing revenue without having to acquire new customers.
V. New vs. Returning Customers
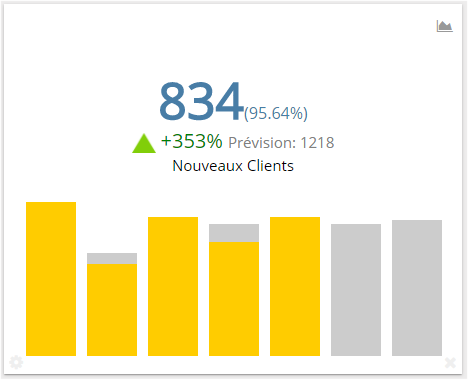
Acquiring new customers will drive the growth of your online store's revenue. However, acquiring a new customer generally costs more than retaining an existing one.
It is recommended to retain your current customers by regularly offering them new products and promotions through a mailing list (newsletter). In an ideal world, you would aim to recruit at least 30% new customers.
Choosing an E-Commerce Analytics Tool
AFS Analytics is a web analytics tool designed for online stores, providing all the metrics described in this article. It is easy to install thanks to plugins for WooCommerce, PrestaShop, and Shopify. The screenshots used in this article come from AFS Analytics' Diamond plan.